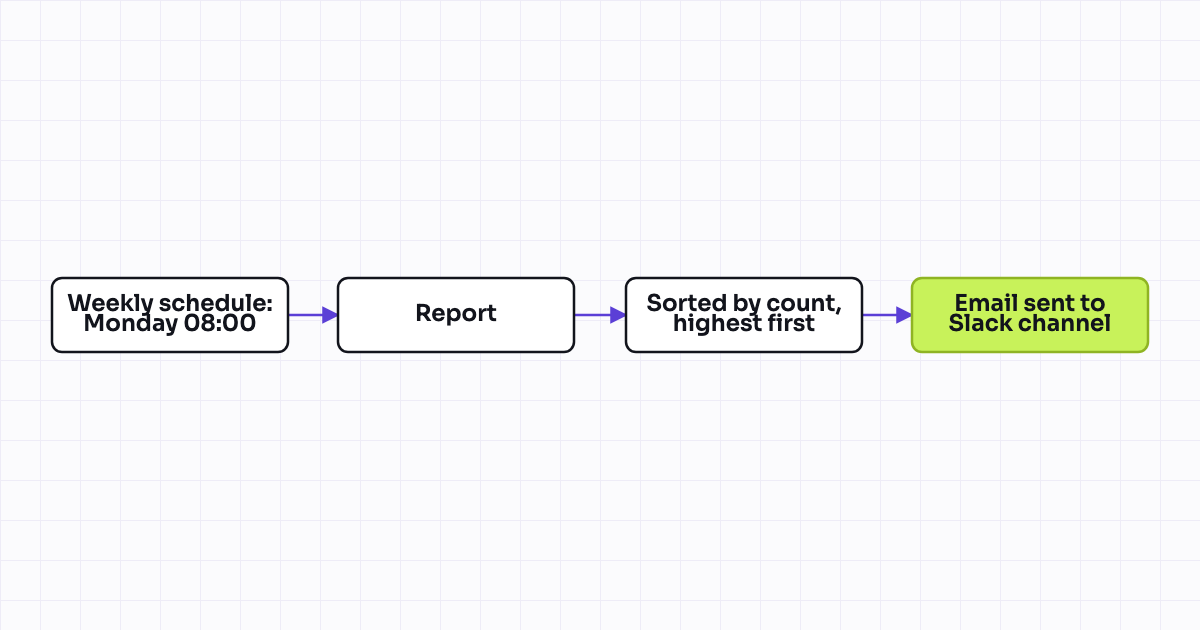
Outcome. Once a week, the sales channel gets a message showing how many new deals were created that week, broken down by lead source, so pipeline creation trends are visible without opening a dashboard.
Workflow map
Enrollment, branches and actions at a glance
reporting-alerts-043
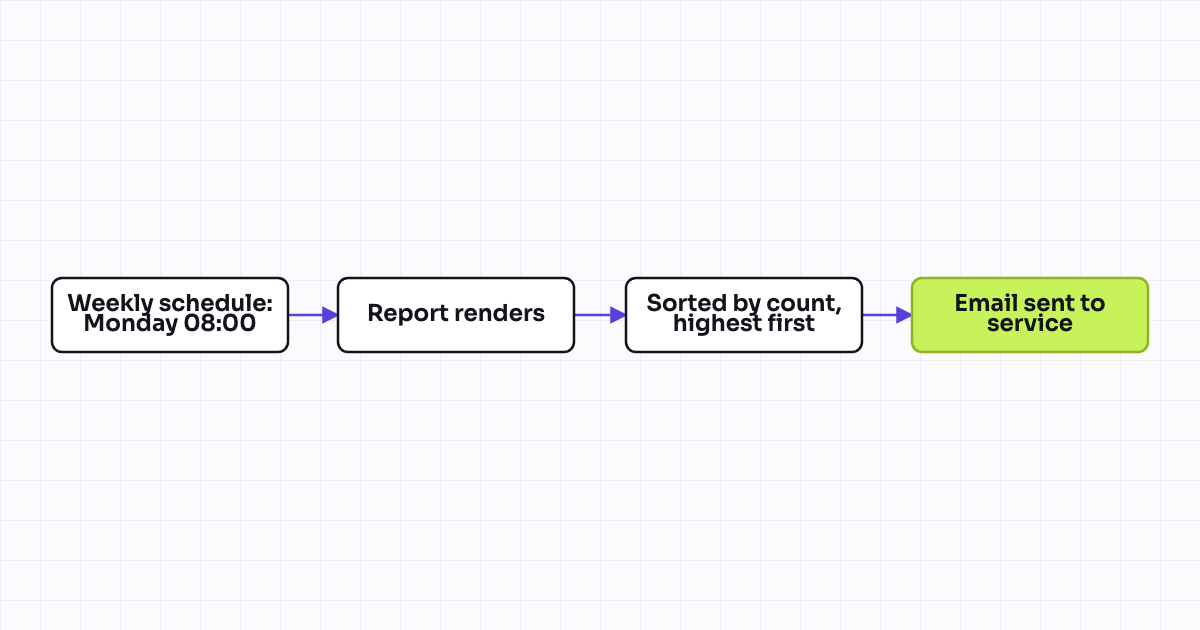
flowchart TD
    A[Weekly schedule: Monday 08:00] --> B[Report: new deals grouped by lead source, last 7 days]
    B --> C[Sorted by count, highest first]
    C --> D[Email sent to Slack channel inbound address]
When to use it, when not to
- UseUse it on a portal with multiple active lead sources (paid, organic, referral, outbound) where sales leadership wants a weekly read on which channel is generating pipeline.
- UseUse it alongside reporting-alerts-009 for a fuller weekly-plus-real-time view of new deal creation.
- SkipDo not use it if deals do not carry a reliable source attribution, whether directly or through their associated contact's original source. The digest will show mostly "unknown" and add little value until source data is cleaner.
- SkipDo not use it as a revenue forecast. This counts deal creation volume only, not amount or likelihood to close.
The preview ends here. Six sections are in the library.
counted, not blurred
PrerequisitesEvery property with its label, internal name, type and options, plus the assets the workflow needs before you start.3 items
EnrollmentThe trigger, the criteria exactly as they are ticked in the UI, the re-enrollment rule and the suppression list.4 parts
StepsEach action in order with its parameters, its branches and its delays, written as you tick them.2 numbered actions
Known pitfallsTraps seen in production, each with what breaks and what to do instead.4 pitfalls
Test plan, variants and build specHow to prove it works in a test portal, where to look when it does not, the variants for other objects or tiers, and the YAML build spec.3 variants, 3 sections
FilesThe properties JSON creates the fields in one API call, the workflow JSON documents the build.PDF, Markdown, JSON
Install1 click. The installer creates the properties this spec declares and the workflow itself, switched off, then opens a task for the prerequisites that are assets rather than properties, such as a team, a static list or a marketing email. What it created is listed on the install page.1 click, switched off
Unlock the full library,
149 EUR
or the reporting and alerts pack, 39 EUR
One-time, excl. VAT. 30-day refund, no questions asked. Founding prices until 31 October, then 199 and 59 EUR. Includes every spec added later, up to the full 500, and the one-click installer on the full library. Building on client portals? The agency licence at 449 EUR covers unlimited client portals.